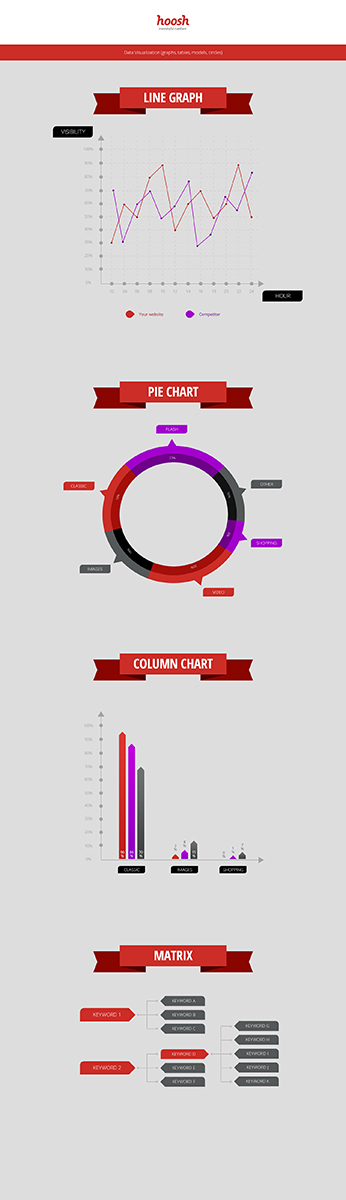
Data Visualization (graphs, tables, models, circles)
Want to win a job like this?
This customer received 29 illustration designs from 7 designers. They chose this illustration design from Fuxxo Works as the winning design.
Join for free Find Design Jobs- Guaranteed
-
 €410
€410
-
 29 designs
-
 7 designers
Illustration Design Brief
We need an intuitive - user friendly - and fresh design line for our data visualization.
You know. Dont Make Me Think!
Our core product is based on the presentation and interpretation of different data sources that we combine into graphs, tables, charts etc and make visible to clients through a web platform and or Reports. Our business area is Search & Social Media Intelligence.
See Hoosh.com for some inspiration in terms of current colors and a better understanding of the company. Our Logo / Name is the only one thing that cannot be changed. Everything else is up to you. Feel free to ask questions.
I have attached a few screenshots of some of our features and as you can see - there has never been a designer on this assignment. We are looking for a long term relationship with a designer that can work with us on an ongoing basis.
Design of graphs/models/circles/tables needs to be able to fit into Infographics also.
We are basically looking for an identity for our data visualization. Meaning that readers / target audience can recognize our graphs and say: Check out the cool graphs by Hoosh :-)
Think: Google, KissMetrics, etc. in terms of data presentation.
Updates
Project Deadline Extended
Reason: Due to illness we lost a few days last week and have not have sufficient time to look through the different designs.
Added Monday, February 04, 2013
Target Market(s)
Marketing People, CEO's, Strategic Planners, Ad Agencies, Decision Makers
Industry/Entity Type
Business
Look and feel
Each slider illustrates characteristics of the customer's brand and the style your logo design should communicate.
Elegant
Bold
Playful
Serious
Traditional
Modern
Personable
Professional
Feminine
Masculine
Colorful
Conservative
Economical
Upmarket
Requirements
Must have
- Must present at least 1 line graph (like file 1 and 2), 1 pie chart, 1 column graph and 1 matrix (like file3).