Technical Ditch Illustration/Cartographic Design
Want to win a job like this?
This customer received 25 graphic designs from 11 designers. They chose this graphic design from VKreativez as the winning design.
Join for free Find Design Jobs-
 US$190
-
 25 designs
-
 11 designers
Graphic Design Brief
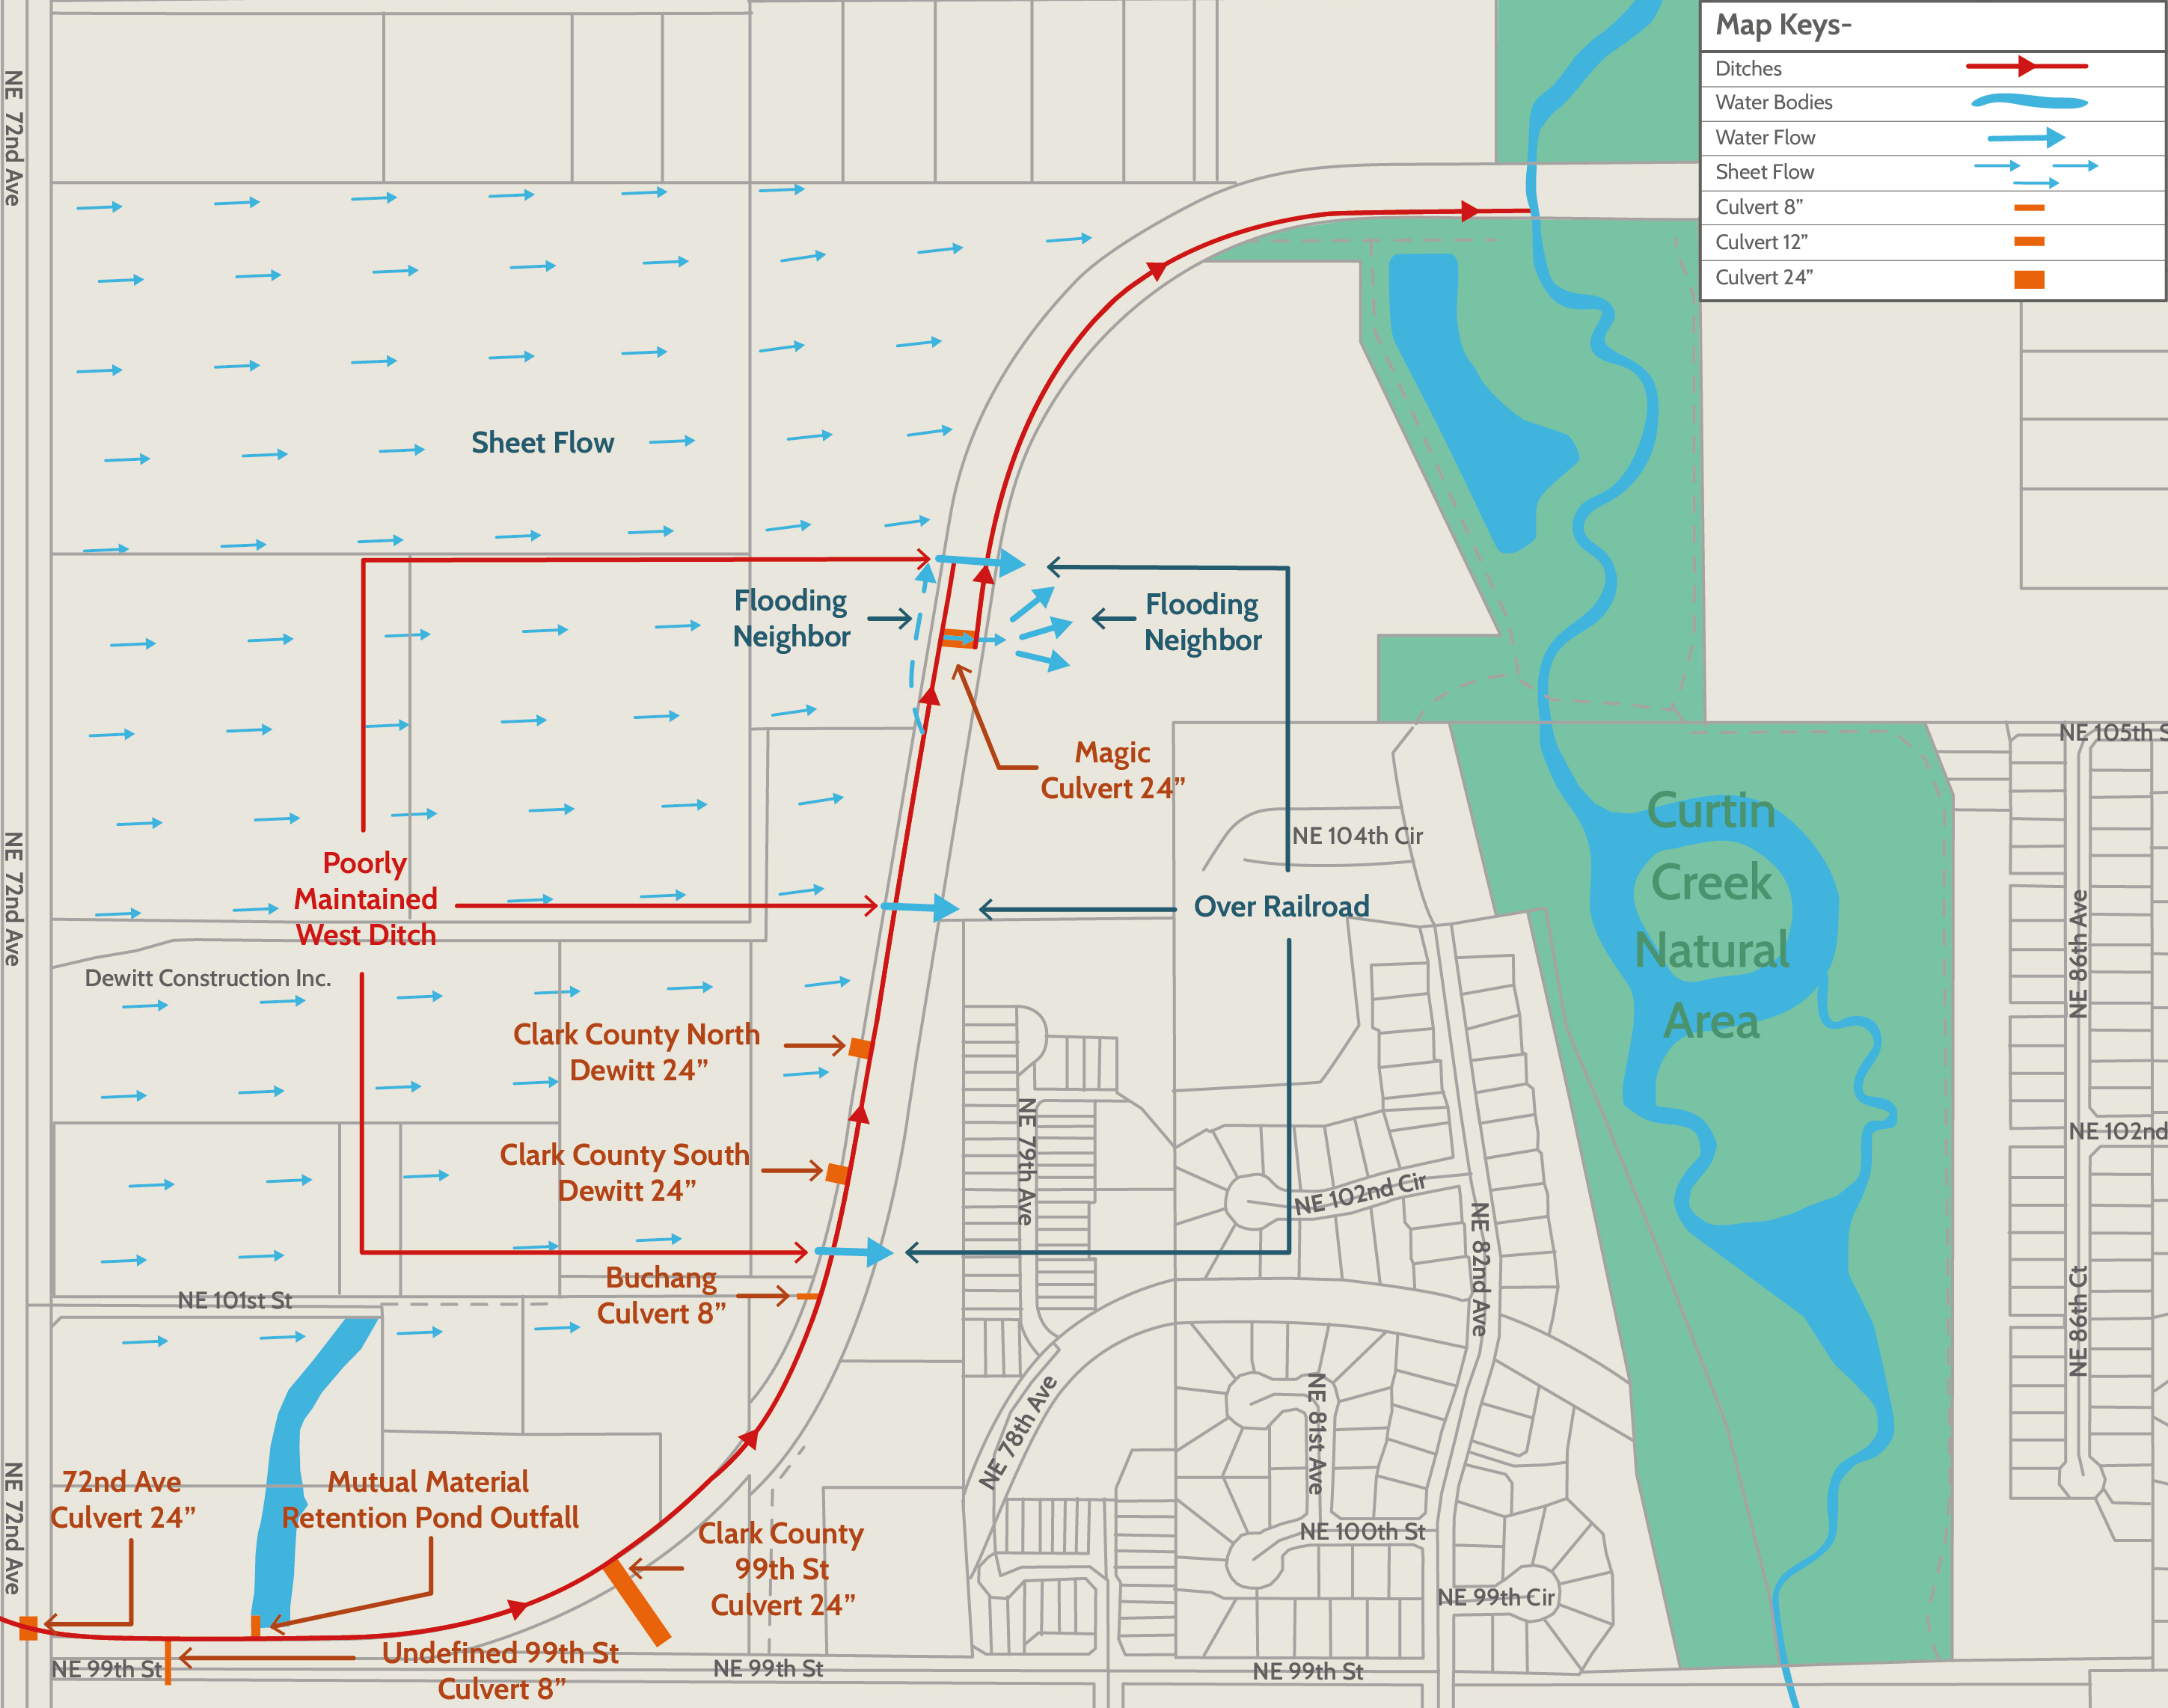
I'm going to add some more information here, as the designs received so far, while appreciated, haven't quite captured what I'm looking for - my fault not theirs. You can see different PDF's of about the same area. There is one with lots of extra red lines running everywhere. That PDF is the Clark County Stormwater system - on paper! The problem is, their system in reality was a fraud. What we're trying to do is to create a visual image to demonstrate how the system really operates. The two red lines on their website, that run parallel north and south are actually supposed to be ditches. These two ditches are on either side of a railroad track. The water is flooding the area including running over the top of the railroad tracks. You can also see where my employee Nate added different water discharges into the west ditch. Those should be noted and labeled on your proposal. All of this water goes into the west ditch and flows north, until the magic culvert takes the water underground to the east ditch. The west ditch then stops shortly north of the magic culvert, it doesn't really exist. There is no east ditch to the south of the magic culvert, it does not really exist. After the magic culvert, the water then flows north in the eastern ditch. The reason we call it the magic culvert is this single 24 inch culvert was supposed to handle all this water from all these upstream sources. Upstream again is south and the water flows north. So I would like the final presentation to reflect the red lines not really existing - as they don't in reality - and be shown as I described above. Then of course the water arrows should flow over the top of the ground as I depicted
Project Goal: Create a single-page professional diagram overlaid on the provided map ("Blank Barberton Map.pdf") to illustrate water flow issues and railroad infrastructure. Use original source from Clark County Website
Deliverable Formats:
High-Resolution PDF (for printing and emailing).
PNG or JPG Image (so I can easily paste it into a PowerPoint presentation).
Visual Requirements (What to Draw):
Background: Use the provided "Blank Barberton Map" as the base layer.
The "Magic Culvert": Mark a specific point on the railroad curve and label it "Magic Culvert."
West Side (Left of Tracks):
Draw broad blue arrows showing water flowing across the property from West to East toward the railroad tracks.
Draw a solid blue line parallel to the tracks on the West side, located only to the North of the Magic Culvert. Label this: "Short section of West ditch."
Crossing the Tracks:
Draw arrows showing water over-topping (flowing over) the railroad tracks at multiple locations along the curve.
Draw a flow arrow going through the Magic Culvert to the East side.
East Side (Right of Tracks):
Show water exiting the culvert and fanning out in multiple directions.
Draw a dashed/broken blue line running South from the culvert. Label this: "Poorly maintained East ditch."
Critical Detail: Do NOT draw a ditch on the East side South of the immediate culvert area. (Annotation: "No East ditch South of this point").
Style: Clean, professional, and easy to read. Use blue for all water/ditch indicators.
Look and feel
Each slider illustrates characteristics of the customer's brand and the style your logo design should communicate.
Elegant
Bold
Playful
Serious
Traditional
Modern
Personable
Professional
Feminine
Masculine
Colorful
Conservative
Economical
Upmarket
Requirements
Nice to have
- For those of you who submitted really quickly, thank you, but apparently one PDF didn't load. The upstream culverts feeding the west ditch need to be added and labeled